A key indicator for underlying home values is flashing a warning sign, suggesting that regional housing market weakness in the South and West is deepening.
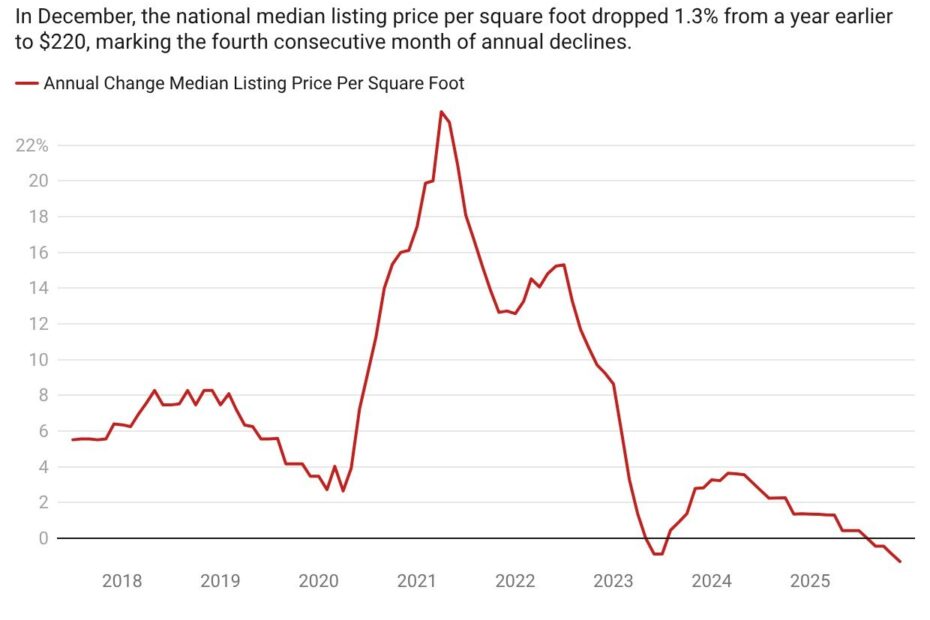
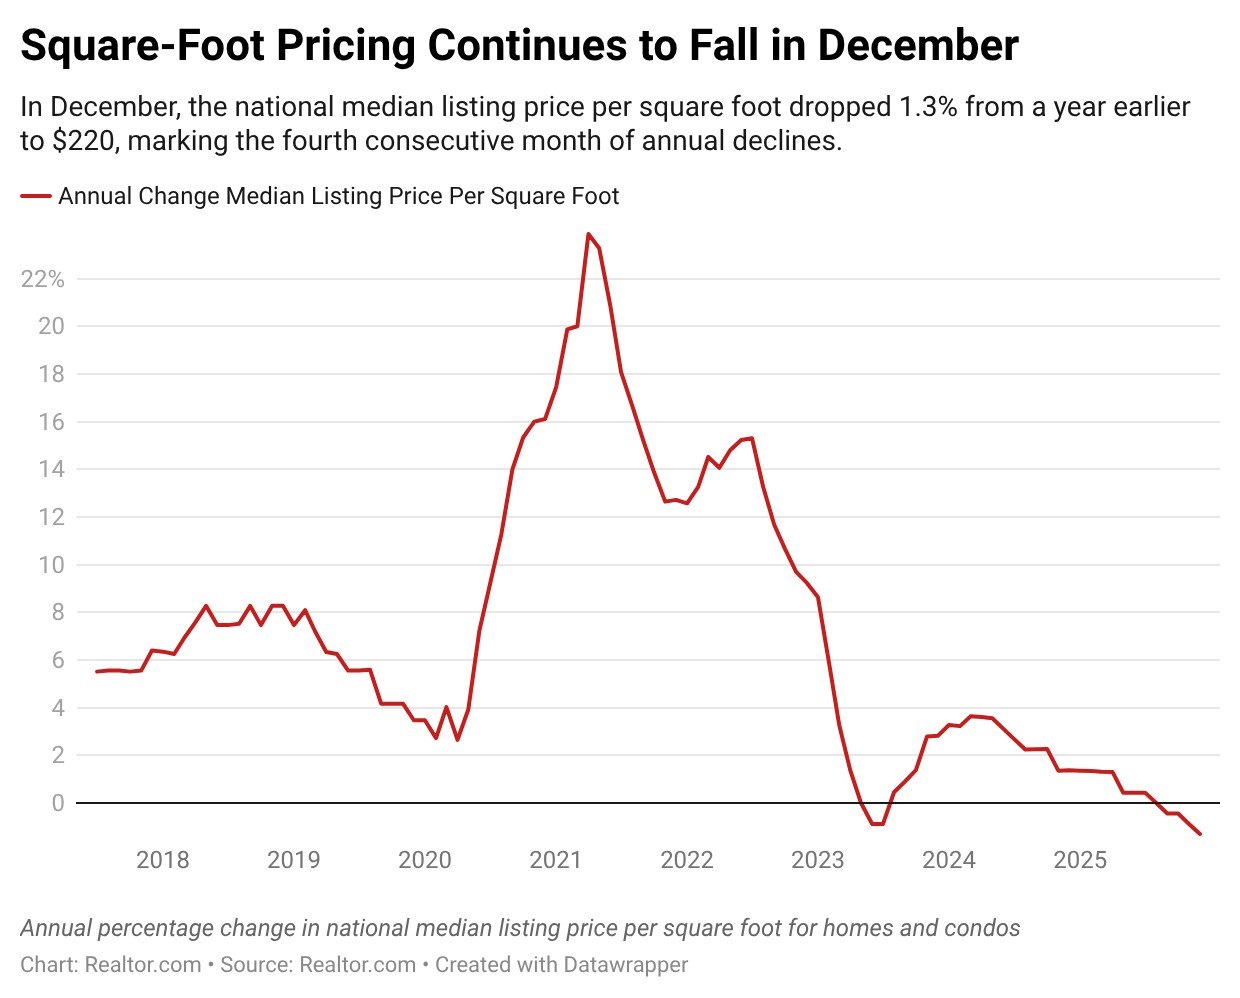
In December, the national median listing price per square foot dropped 1.3% from a year earlier to $220, marking the fourth consecutive month of annual declines, according to data from the Realtor.com® monthly housing trends report.
Pricing per square foot is significant because it accounts for the sizes of homes on the market, while overall median listing prices can rise or fall based on the share of listings that are condos or smaller homes.
In Realtor.com data going back to 2017, square-foot list pricing had never fallen by more than 1% annually until December. Aside from the recent downturn, the figure has only turned negative once in the past nine years, dipping briefly in the summer of 2023, when overall home sales prices also briefly turned negative.
Digging into the more recent downturn, it is clear that the trend is strongly regional, with falling listing prices in the South and West driving essentially all of the downturn in the headline national figure.
In December, listing prices per square foot were down 2.4% annually in the South and fell 1.4% in the West, while rising 1.8% in the Midwest and 4.4% in the Northeast.
“Particularly in the South and West, I think the downward trend in list price per square foot signals the potential for improving affordability heading into 2026,” says Realtor.com Senior Economist Jake Krimmel. “Whether that will actually translate into declining sales prices remains to be seen.”
The regional divergence in price per square foot is even more pronounced than that in inventory, which has surged back above pre-pandemic levels in the South and West but remains constrained in the Northeast and Midwest.
Nationwide, the total supply of homes for sale in December remained 12.5% below the average seen from 2017 to 2019 levels.
However, inventory in the South (+4.5%) and the West (+1.1%) is actually up from that pre-pandemic average, while the Midwest (-33.1%) and Northeast (-50.4%) continue to lag significantly.
Consequently, home values have so far remained strong in the Midwest and Northeast even in a slow sales environment.
“The Northeast and Midwest are perennially supply-constrained in both the existing home and new home segments,” says Krimmel. “And price growth even in a high-rate environment reflects that.”
Despite the recent declines, listing prices remain far above their pre-pandemic levels, even in the softening South and West regions.
Since December 2019, the typical list price has climbed 33.4% nationally, while price per square foot is up 47.9%.
These long-term increases have significantly affected affordability, even before adding the impact of higher mortgage rates.
Meanwhile, prospective homebuyers who have awaited a price correction have so far been disappointed, with home prices continuing to rise by about 2% nationally in 2025, despite very low transaction volume.
“I will say that one of the biggest puzzles of 2025 was why list prices did not fall nationally despite growing inventories and increased time on market,” says Krimmel.
The economist says that the most likely explanation is that sellers remained very anchored to the peak prices seen during the pandemic buying boom, perhaps with unreasonable expectations about the current state of buyer demand.
“Heading into 2026 it could be that sellers are finally recognizing the market is moving in a buyer-friendly direction, and so asking prices must come down as a result,” says Krimmel.